

ERSPAN#
ERSPAN is the acronym for Encapsulated Remote Switched Port Analyzer. It mirrors traffic on one or more source ports and delivers the mirrored traffic to one or more destination ports. The traffic is encapsulated in Generic Routing Encapsulation (GRE), which is therefore routable across a Layer 3 network between the source switch and the destination.
Changed in version 20.2.0: From FlowPro 20.2. onwards, ERSPAN devices should be configured to use a FlowPro appliance’s management (mgmt) interface as the destination IP address for mirrored traffic (as opposed to a monitor (e.g., mon1) interface in previous versions).
On this page:
Configuration#
Configuration is required on both the FlowPro and the ERSPAN/GRE device, as each device’s setup requires information from the other.
Prerequisites#
The following information should be determined prior to starting the configuration:
ERSPAN device configuration#
ERSPAN Source IP: The IP address on the device (switch or router) or the ESXi host IP address (VDS).
Destination IP: The FlowPro management (
mgmt) interface IP address.ERSPAN Type/Version: Legacy ERSPAN = Type 1/Ver 0, Type II = Ver 1, Type III = Ver 2
Note
The setup utility configures virtual destination interfaces for ERSPAN Type II (version 1) and Type III (version 2).
For legacy ERSPAN (Type I) or plain GRE delivery, contact Plixer Technical Support.
FlowPro ERSPAN configuration#
As of FlowPro 20.2.0, ERSPAN/GRE traffic is received on the management (mgmt) interface. Monitor interfaces no longer need to be assigned their own IP address for ERSPAN, which avoids the address collisions that occurred when a monitor interface shared a subnet with the management interface.
Run the following command:
sudo ./setup.sh --erspan-configConfirm that you want to configure an ERSPAN destination.
ERSPAN/GRE traffic is received on the mgmt interface.

Configure a Virtual Type II/III ERSPAN destination now? (yes/no): yes
Enter the ERSPAN source IP, which is the address of the switch, router, or ESXi host sending the mirrored traffic.
Enter your ERSPAN source IP: 192.168.1.1
Enter the local ERSPAN destination IP. This defaults to the appliance’s
mgmtinterface address, which can be accepted by pressing Enter.Enter your Local ERSPAN destination IP [192.168.1.24]:
Enter the ERSPAN version.
###########################################################
ERSPAN Version Map: ERSPAN Type II = 1, ERSPAN Type III = 2
###########################################################
Enter your ERSPAN Version: 2
Enter the ERSPAN ID configured on the source device.
Enter your ERSPAN ID: 32
Review the summary and confirm the values to apply the configuration.
You have entered:
ERSPAN ID: 32
Source IP: 192.168.1.1
Destination IP: 192.168.1.24
GRE Key:
Device: mgmt
Are these values correct? (yes/no): yes
FlowPro then creates a virtual ERSPAN interface named fp_erspan_<ERSPAN_ID> (for example, fp_erspan_32), brings it up, and automatically pairs it with itself as an observation point.
Important
Unlike earlier versions, --create-observation-point does not need to be run afterwards for the ERSPAN interface. The observation point is created as part of the ERSPAN setup.
Note
The ERSPAN ID determines the interface name, so each ERSPAN ID supports a single configuration. Re-running the setup with an ID that is already in use replaces the existing interface and its saved configuration.
The setup raises the MTU of the receiving interface to 1900 bytes to accommodate GRE encapsulation overhead.
Each configuration is saved to
/home/plixer/flowpro/erspan_configs/and re-created on startup by theerspansystem service, so ERSPAN interfaces persist across reboots.The appliance firewall permits GRE on all interfaces, including
mgmt.
Device-specific configuration#
Cisco switch#
monitor session 1 type erspan-source
description ERSPAN direct to FlowPro
erspan-id 32                              # required
vrf default                               # required
destination ip 10.1.2.3                   # IP address of the FlowPro mgmt interface
source interface port-channel1 both       # Port(s) to be sniffed
no shut                                   # enable

monitor erspan origin ip-address 10.1.2.1 global
VMware VDS#
Note
This requires the VMware Enterprise Plus license and a configured vSphere Distributed Switch.
From the VMware web console, do the following:
Select the VDS from the list of networks.
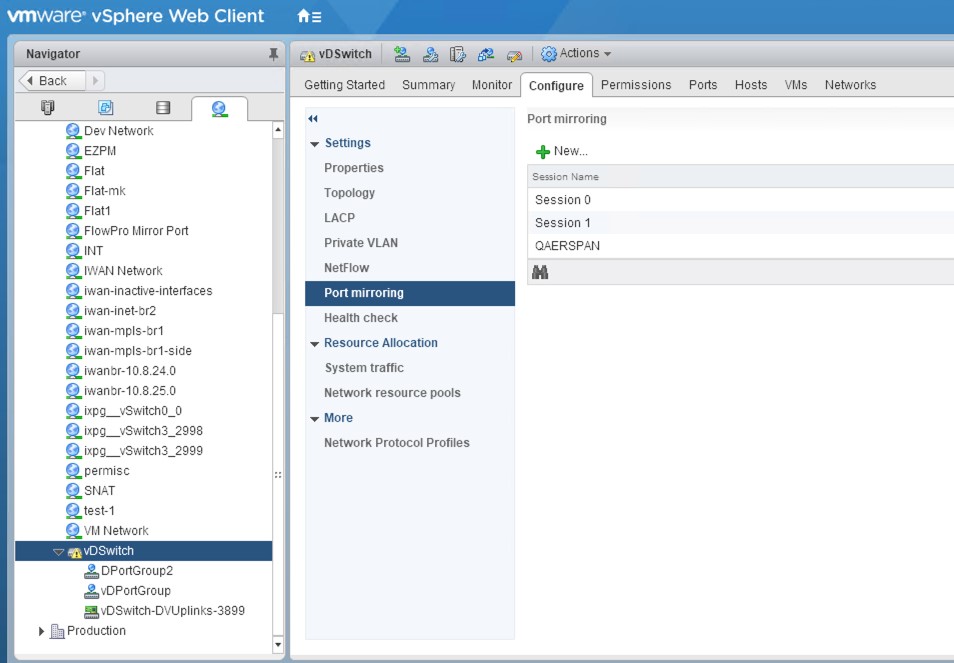
Select Port mirroring on the Configure tab.
Select New… to create a new session.
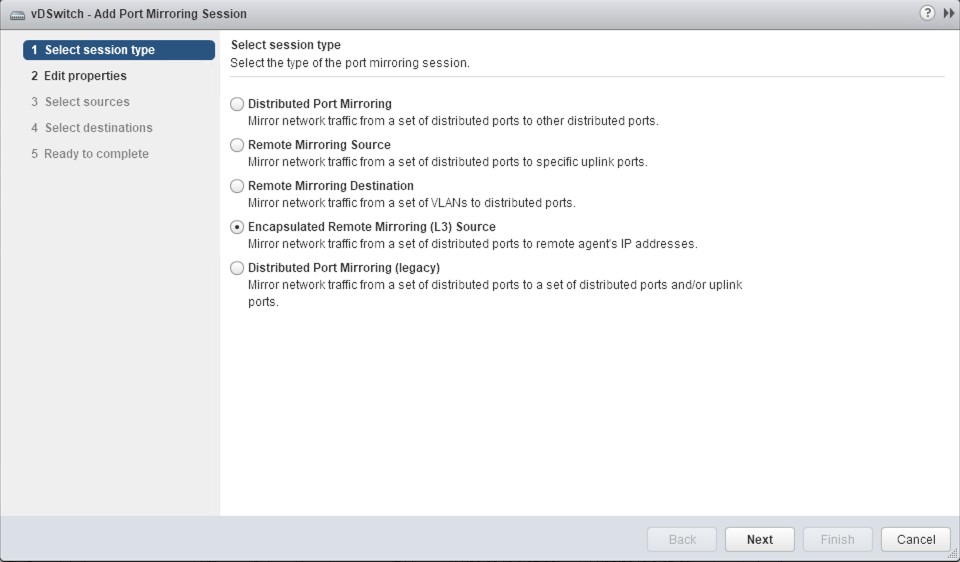
Select Encapsulated Remote Mirroring (L3) Source, and then click Next.
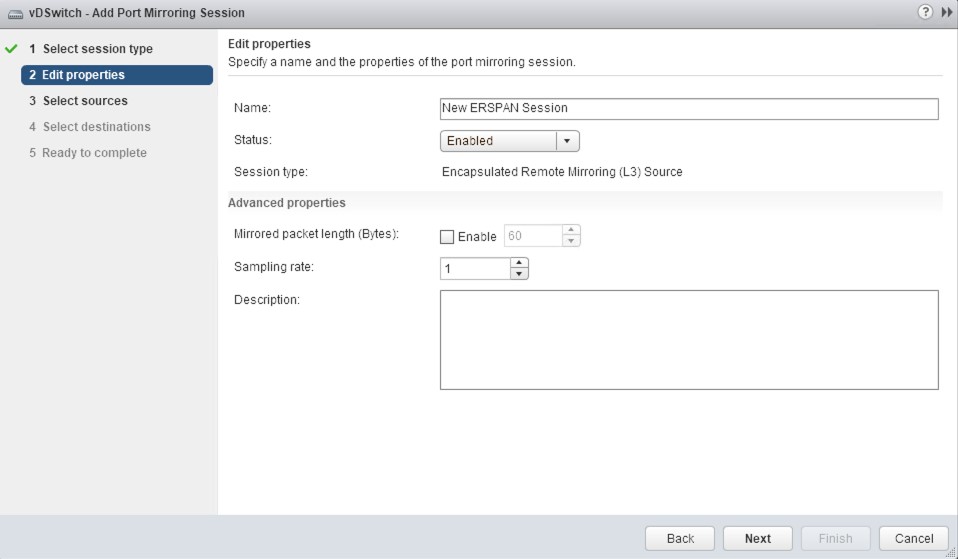
Give the new session a name, set the status to Enabled, and then click Next.
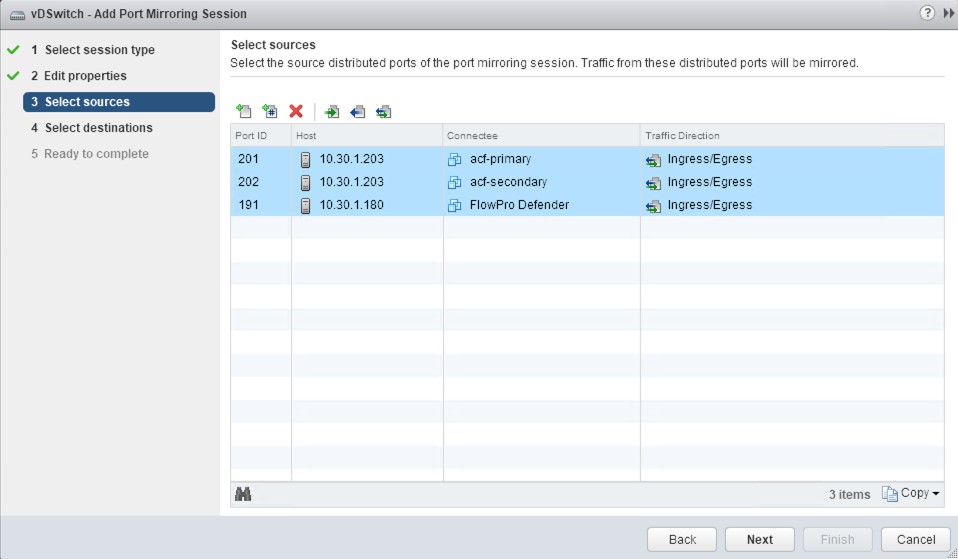
Add the ports intended to mirror to the probe, and then click Next.
Add the IP address of the probe’s management (
mgmt) interface as the destination of the session, and then click Next.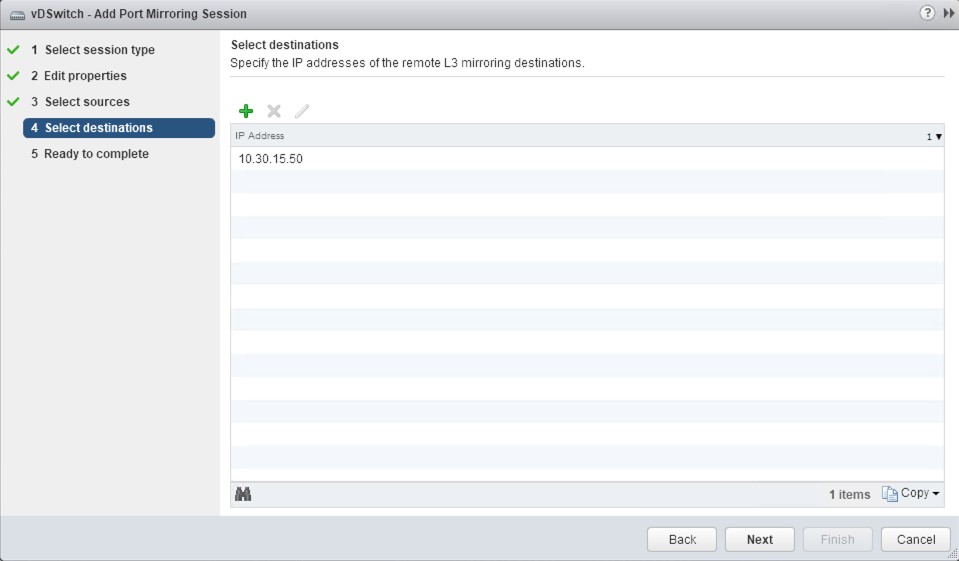
Verify the configuration, and then click Finish to start the session.
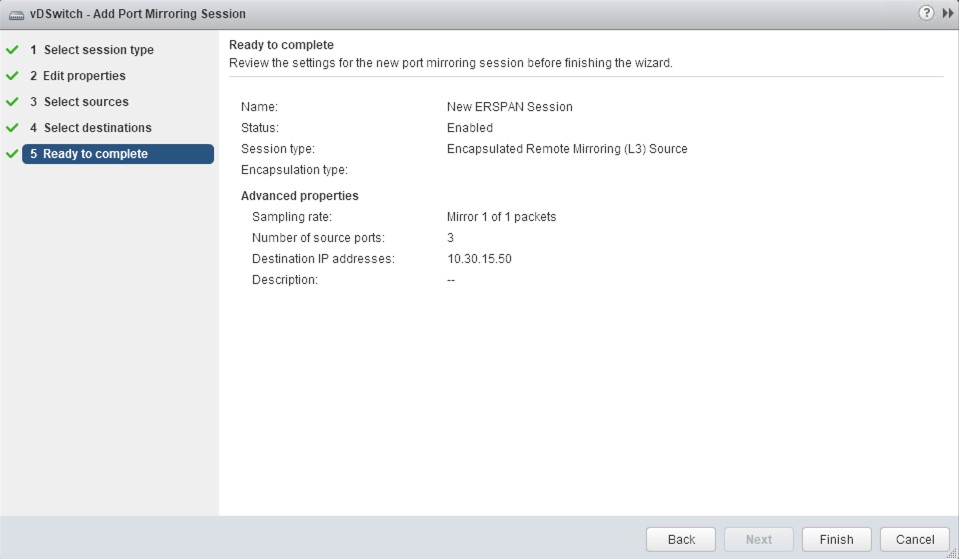
Note
Specific commands and configuration options may vary between devices and versions. Command syntax should be verified with vendor documentation for the specific device being configured.