Forecasting with Plixer Network Intelligence
Learning from the network metadata collected by Plixer Scrutinizer, forecasting provides insight into future network behavior. Data is selected via the Plixer Scrutinizer reporting interface and is supported with all report types. This allows for the use of reporting filters to select specific classes of traffic.
Forecast horizon
A forecast horizon determines how far into the future we want to forecast. In the initial release of forecasting, the horizon is determined by the volume of input data, ensuring statistically sound results. Future releases will allow for advanced configuration options where the user can balance forecast length and forecast variance.
Forecast horizons are determined as follows:
If the input data is between 0 and 3 days:
- No seasonality applied, likely result is mean reversion unless there is a legitimately strong AC relation
- Forecast horizon = 1/3rd the original report width, 1/4 of the total view with forecast appended
If the input data is between 3 and 14 days:
- Daily seasonality selected
- Forecast horizon = floor round # of seasons (days) in report / forecast_horizon_ratio (2 by default)
If the input data is between 14 and 45 days:
- Weekly seasonality selected
- Forecast horizon = floor round # of seasons (weeks) in report / forecast_horizon_ratio (2 by default)
If input data is 45+ days:
- Monthly seasonality selected (likely to be deprecated for weekly season)
- Forecast horizon = floor round # of seasons (months) in report / forecast_horizon_ratio (2 by default)
Creating a forecast
Forecast creation begins by creating a report that represents the traffic classes to forecast. The quantity being forecast will be the primary data column from the initial report (bytes, packets, counts, milliseconds of latency, etc). When selecting the time bounds of the report, try to provide as much history as possible, while excluding regions behavior should not be considered (i.e., a period of 0 utilization before a new application was implemented/observed in NetFlow).
The data source for the report should be as granular as possible, 30m is optimal for most mid-to-long term forecasts (days/weeks ahead), 2hr is optimal for long term forecasts (months/quarters). High-resolution data 1m/5m should be used for non-seasonal “real-time” monitoring. Application performance metrics such as stream jitter or various qualities of TCP latency should be monitored on a LastX time interval with the highest possible resolution reporting performance allows.
When the appropriate data has been selected, click the Plan Position Indicator Plot icon, located in the upper right hand corner of the reporting interface.
When prompted, give the forecast a title & submit. At this point you will be forwarded to the forecast menu (Investigate>Forecasts) forecast menu (Investigate>Forecasts)
The forecast menu lists all forecasting tasks. The primary view features the forecast id#s, the forecast title, a link to the source report used as input data, created by, the status of the forecast service in relation to that task, and data-ready date.
The refresh icon allows the user to update the forecast from the forecast menu. Input data reports with dynamic (LastX) time selections will remain up to date on refresh.
Forecasting service status
Forecasting jobs are processed within the Plixer ML Engine, remote to Plixer Scrutinizer. The status field of the forecast menu displays the current status of a task on the remote system.
- Initializing: Plixer Scrutinizer has made the task available for consumption by the forecasting service
- Starting: The forecasting service as accepted the task and queued it to run
- Data Retrieval: The Plixer Scrutinizer reporting API is queried by forecasting, to collect input data.
- Processing: Input data received and pre-processed for model training
- Strategy Selection: Optimal method for producing forecast chosen based on input data characteristics
- Learning: The forecasting model is learned from provided input data
- Prediction: A prediction is made for the forecast horizon and results are returned to Plixer Scrutinizer
- Complete: The remote forecasting service has provided results and closed this session
Clicking on any forecast title will open the forecast display.
Forecast display
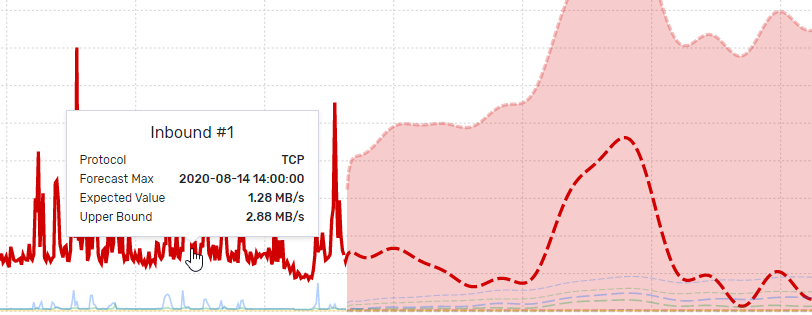
The forecast display shows a plot of the forecast and the input data. Each line segment will active on mouse hover, showing the critical boundaries of the forecast in the shaded region. This screen is intended to help users visually verify the forecast provided.

The data provided in the tools tips and the table below provide insight into the time interval of highest expected usage, easily allowing for the identification of hot spots in network time.