Grafana integration
Overview
The Grafana integration provides users with high-level reports in their Grafana instance along with the ability to perform a forensic investigation and more sophisticated filtering via Plixer Scrutinizer’s UI.
Installing the plugin
Plixer is working with Grafana to make this plugin available in their plugin repo. At the moment, you can install the plug by cloning it into the plugins directory. Depending on the OS you are running, the path will vary.
- Linux : ‘/var/lib/grafana/plugins’
- Windows : ‘/data/plugins’ *
When inside the directory, run the following command:
git clone https://github.com/plixer/scrutinizer-datasource.git
Once the data source is cloned, restart the Grafana server and proceed with adding the data source to Grafana.
Hint
You may need to create the data/plugins directory on a Windows system.
Adding datasource to Grafana
- In the Grafana user interface, navigate to Settings and select Data Sources in the Configuration section.

- Select the Plixer Scrutinizer Datasource.
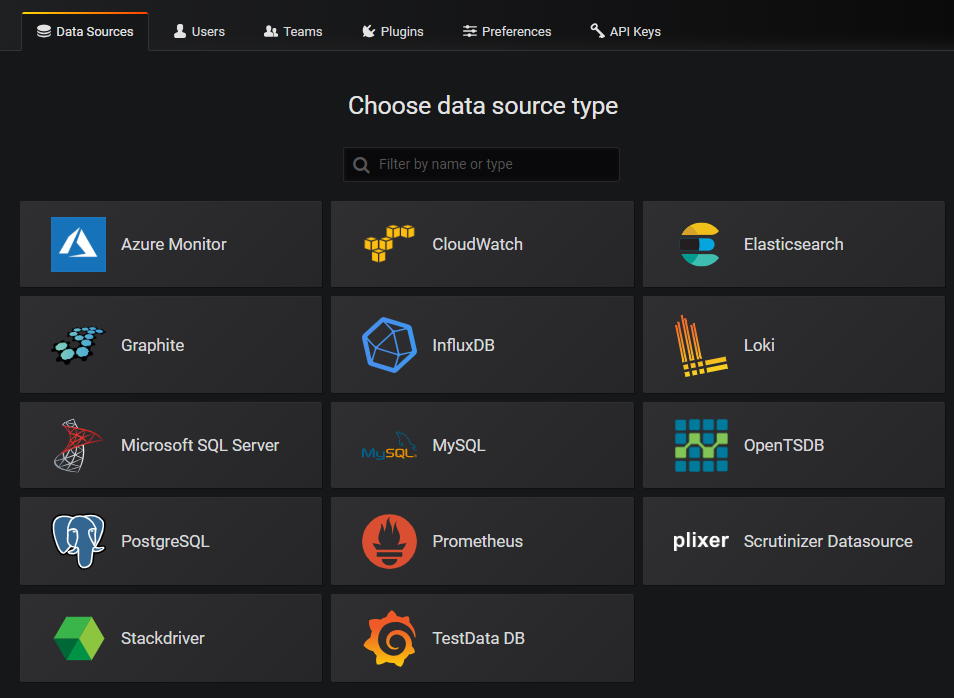
Setting up Plixer Scrutinizer data source
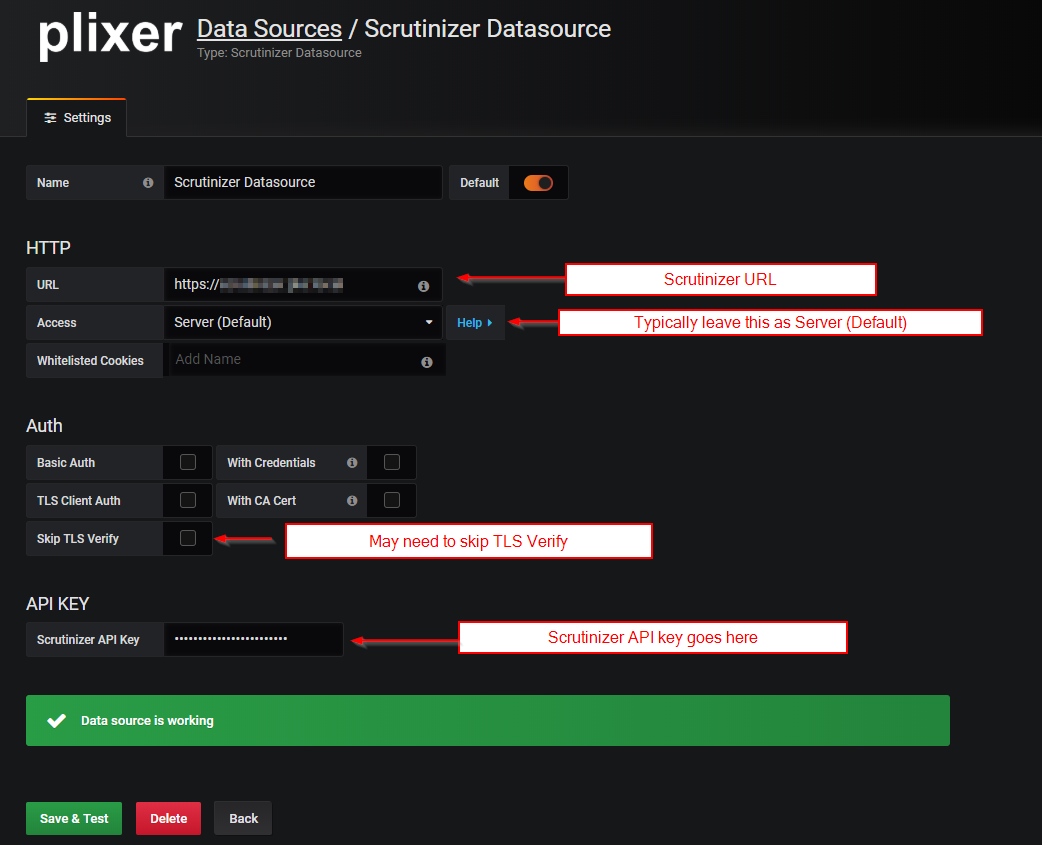
- Fill out the required fields:
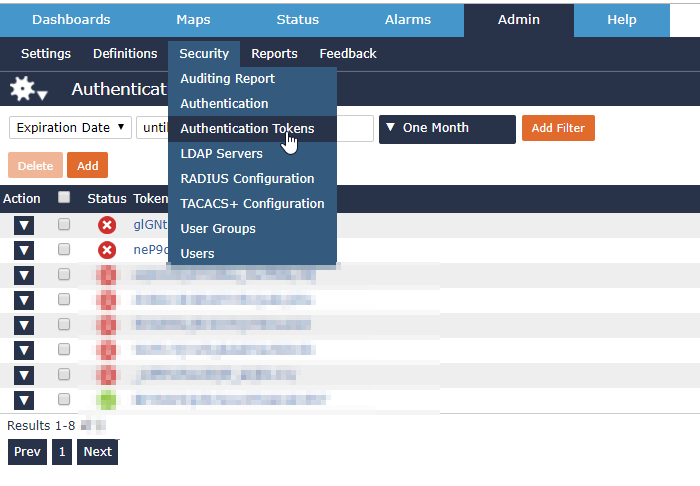
- Generate an authentication token in Plixer Scrutinizer via the Admin Tab - > Security - > Authentication Token page.
If you are getting an error, it can be due to a self-signed SSL certificate.

If that is the case, check off the ability to skip TLS verify.

Report JSON (API)
You can view the JSON data that the back end passed to the front end in order to render any Plixer Scrutinizer report. When in a report, click Filters/Details to open a module where you can select the Report JSON (API) tab:

Running reports
Reporting is done primarily by populating the drop-down menus.

The report will only render if you have selected something from each drop-down or you have selected to add a filter.
The data is going to be represented in bits/second. Make sure Grafana is displaying it this way by updating the visualization field:
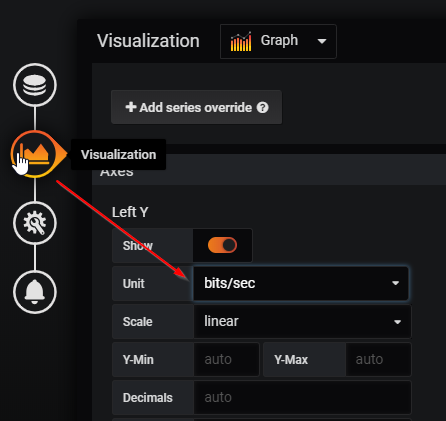
Specifying a report
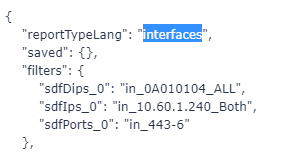
The Select Report drop-down menu comes with a few recommended reports. Instead of populating all the reports in the dropdown, you can put any report name you like in the box. To find out the report names, run the report in Plixer Scrutinizer and look at the report JSON. Once you have the report name, copy and paste it into the box and press Enter.

Adding filters
Plixer Scrutinizer offers a powerful filtering engine that can also be leveraged by the data source. The easiest way to pass filters to the data source is to first build them within Plixer Scrutinizer to get a feel for the format.
For example, to see what JSON would be needed to pass a filter for host 10.60.1.240 and application TCP 443, build the filters in Scrutinizer and then look at the api_report.

Then copy from the opening bracket to the closing bracket and paste the filter within Grafana. Select Apply Filter.

Keep in mind the “sdfDips_0” will be ignored. This references the device in Plixer Scrutinizer you were looking at when you built the filters. You can leave it in if it’s easier to paste that way, or you can remove it. Both will yield the same results.
