Environment sizing#
To ensure consistently optimal performance and continuous availability, Scrutinizer must be provisioned based on the functions and/or features required by its users.
This section outlines the recommended procedures for calculating the appropriate resource allotments for Scrutinizer deployments.
Note
Certain steps in these guides require access to the Scrutinizer web interface. For more accurate results, complete the initial setup wizard beforehand.
On this page:
CPU/RAM#
Follow the steps described in this section to determine the total number of CPU cores and amount of RAM that will be required by a Scrutinizer deployment.
Note
For additional guidelines related to distributed clusters, see this section.
Determine CPU and RAM requirements for flow collection, reporting, and core alarm policies based on expected flow rate and exporter count:
CPU cores and RAM based on flow rate and exporter count
Exporters
F/s
5
25
50
100
200
300
400
500
5k
8 CPU 16 GB
8 CPU 16 GB
10 CPU 20 GB
14 CPU 28 GB
20 CPU 39 GB
26 CPU 52 GB
32 CPU 67 GB
38 CPU 82 GB
10k
8 CPU 16 GB
8 CPU 16 GB
12 CPU 24 GB
18 CPU 36 GB
25 CPU 50 GB
32 CPU 65 GB
38 CPU 81 GB
43 CPU 97 GB
20k
16 CPU 32 GB
16 CPU 32 GB
16 CPU 32 GB
24 CPU 48 GB
32 CPU 64 GB
38 CPU 80 GB
43 CPU 96 GB
48 CPU 112 GB
50k
32 CPU 64 GB
32 CPU 64 GB
32 CPU 64 GB
32 CPU 64 GB
39 CPU 80 GB
44 CPU 96 GB
48 CPU 112 GB
52 CPU 128 GB
75k
46 CPU 96 GB
46 CPU 96 GB
46 CPU 96 GB
46 CPU 96 GB
46 CPU 96 GB
49 CPU 112 GB
52 CPU 128 GB
55 CPU 144 GB
100k
52 CPU 128 GB
52 CPU 128 GB
52 CPU 128 GB
52 CPU 128 GB
52 CPU 128 GB
52 CPU 128 GB
55 CPU 144 GB
58 CPU 160 GB
125k
58 CPU 160 GB
58 CPU 160 GB
58 CPU 160 GB
58 CPU 160 GB
58 CPU 160 GB
58 CPU 160 GB
58 CPU 160 GB
61 CPU 176 GB
150k
64 CPU 192 GB
64 CPU 192 GB
64 CPU 192 GB
64 CPU 192 GB
64 CPU 192 GB
64 CPU 192 GB
64 CPU 192 GB
64 CPU 192 GB
Determine additional CPU and RAM requirements to support the feature sets that will be enabled:
Note
Each FA algorithm reports detections using one or more alarm policies, which are also enabled/disabled as part of the feature set. Policy-to-algorithm associations can be viewed in the Admin > Alarm Monitor > Alarm Policies view.
The CPU and RAM allocations per feature are recommended for deployments with up to 500 exporters and a total flow rate of 150,000 flows/s.
Feature resource requirements and FA algorithms
Feature
CPU
RAM
FA Algorithms
Streaming (to a Plixer ML Engine or external data lake)
1 cores
0.4 GB
N/A
Basic Tuple Analysis
5.85 cores
3.3 GB
DNS Hits
FIN Scan
Host Reputation
ICMP Destination Unreachable
ICMP Port Unreachable
Large Ping
Odd TCP Flags Scan
P2P Detection
Packet Flood
Ping Flood
Ping Scan
Reverse SSH Shell
RST/ACK Detection
SYN Scan
TCP Scan
Network Transports
UDP Scan
XMAS Scan
Application Analysis
0.25 cores
0.1 GB
Protocol Misdirection
Worm Analysis
0.5 cores
0.2 GB
Lateral Movement Attempt
Lateral Movement
FlowPro DNS Exfiltration Analysis
0.5 cores
0.2 GB
DNS Command and Control Detection
DNS Data Leak Detection
FlowPro DNS Basic Analysis
0.25
0.1 GB
BotNet Detection
JA3 Analysis
0.25
0.1 GB
JA3 Fingerprinting
FlowPro DNS Server Analysis
0.25 cores
0.1 GB
DNS Server Detection
FlowPro Domain Reputation Analysis
0.25 cores
0.1 GB
Domain Reputation
Firewall Event Analysis
0.25 cores
0.1 GB
Denied Flows Firewall
Scan Analysis
1.0 cores
0.4 GB
Bogon Traffic
Breach Attempt Detection
NULL Scan
Source Equals Destination
Jitter Analysis
0.25 cores
0.1 GB
Medianet Jitter Violations
DNS Lookup Analysis
0.25 cores
0.1 GB
NetFlow Domain Reputation
DoS Analysis
0.5 cores
0.2 GB
DDoS Detection
DRDoS Detection
Host Index Analysis
2.4 cores
2.4 GB
Host Watchlist
Incident Correlation
IP Address Violations
Provision the Scrutinizer appliance with the CPU and RAM totals obtained from steps 1 and 2.
In the web interface, navigate to Admin > Resources > System Performance and verify that the correct CPU core count and RAM amount are displayed for the collector.
After confirming that CPU and RAM allocations have been correctly applied, go to Admin > Resources > System Performance > Feature Resources and enable/disable features according to the selections made for step 2.
Once Scrutinizer is fully configured and running, CPU and RAM utilization can be monitored from the Admin > Resources > System Performance page using the CPU Utilization and Available Memory graphs. These graphs should be reviewed regularly (in addition to after resources are initially allocated), so that any necessary adjustments can be made.
Important
After making any adjustments to Scrutinizer’s resource allocations, launch scrut_util as the root user and run the set tuning command to re-tune the appliance.
Note
Events related to resource utilization (e.g. collection paused/resumed, feature set paused/resumed, etc.) are reported under the System category of alarm policies.
Setting up large numbers of notification profiles, report thresholds, and/or scheduled email reports may also impact performance.
Storage#
The Admin > Resources > System Performance page of the web interface summarizes disk utilization for individual collectors in a Scrutinizer environment. A more detailed view that shows actual and expected storage use for historical flow data can also be accessed by drilling into a specific collector.
Described below are the main factors that influence a Scrutinizer collector’s disk utilization and recommendations for anticipating additional storage needs.
Data retention#
Scrutinizer’s data history settings can be used to adjust how long Scrutinizer stores aggregated flow data, alarm/event details, and other data. With the default settings, a collector provisioned with the minimum 100 GB of storage can store up to 30 days of NetFlow V5 data for a maximum of 25 flow-exporting devices with a combined flow rate of 1,500 flows/s.
For more accurate and detailed projections of disk space requirements based on specific data retention settings, the following database size calculator can be accessed from the data history settings tray:
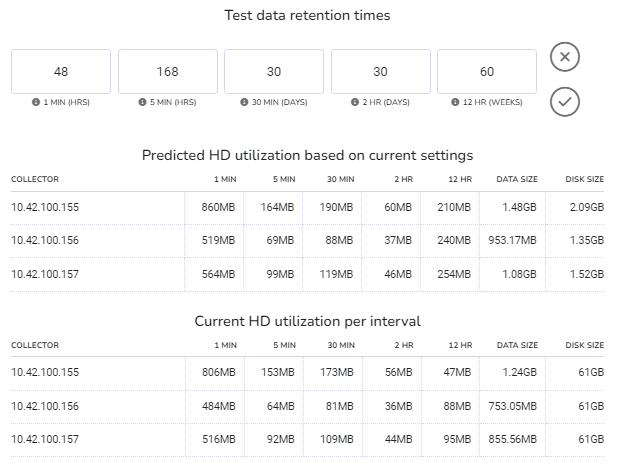
The calculator shows both current and predicted disk usage for each historical flow data interval based on the retention times entered. Details are shown by collector, with total predicted usage and total storage currently available also included.
Note
More detailed storage utilization information can be accessed by drilling into a collector from the Admin > Resources > System Performance page.
Scrutinizer’s functions are highly I/O intensive, and there are many factors that can impact the system’s disk-based performance, such as the size/complexity of flows being received and flow cardinality. To ensure optimal performance, 15k HDDs or SSDs in a RAID 10 are recommended.
Auto-trimming#
Scrutinizer automatically trims older historical flow data when available disk space falls below the Minimum Percent Free Disk Space Before Trimming value configured in the data history settings.
Auto-trimming can be disabled by unticking the Auto History Trimming checkbox, but flow collection and other functions may be paused when available storage runs low. The amount of storage for the collector can also be increased to retain older records.
Host indexing#
When host indexing is enabled, it may become necessary to allocate additional CPU cores, RAM, and disk space to Scrutinizer collectors.
Host to host indexing can have a significant impact on disk utilization due to the two types of records stored:
Continuously active pairs, for which records will not expire
Ephemeral unique pairs, for which records will expire but are also replaced at approximately the same rate
Storage requirements#
To approximate the amount of additional disk space that will be used by the host to host index:
Create/run a new Host to Host pair report and add all exporters that were defined as inclusions for the Host Indexing FA algorithm.
Set the time window to cover a period of at least 24 hours.
When the output of the report is displayed, click the gear button to open the Options tray and select Global.
In the secondary tray, select the 5m option from the Data Source dropdown and click Apply before returning to the main view.
Note the total result count, which will be roughly equivalent to the number of active pairs.
Return to the Options > Global tray and switch to the 1m data source option.
Subtract the previous result count from the updated total result count to determine the number of ephemeral pairs.
After obtaining the active pair and ephemeral pair counts, the following formula can be used to calculate additional disk space requirements for host to host indexing:
(Active pair count + Ephemeral pair count) * Exporter count * 200 B
where Exporter count corresponds to the total number of exporters/inclusions defined for the Host Indexing algorithm.
Utilization alerts#
If the combined disk space used by the host and host pair databases reaches 100% of the Host Index Max Disk Space setting of the Host Indexing algorithm, host and host to host indexing will be suspended until storage becomes available again.
The following alarm policies are used to alert users to high disk utilization by host indexing:
Policy |
Description |
|---|---|
Host Index Disk Space Warning |
Triggered when the disk space used by host indexing functions reaches/exceeds 75% of the specified Host Index Max Disk Space |
Host Index Disk Space Error |
Triggered when host indexing functions are suspended because the Host Index Max Disk Space has been reached |
Host Index Disk Availability Error |
Triggered when host indexing functions are suspended because disk utilization for the volume the host and host pair databases are stored on has reached/exceeded 90% |
Host indexing functions will automatically restart once sufficient storage is available, either due to record expiry or because disk space has been added.
Distributed clusters#
Distributed clusters consisting of one primary reporting server and multiple remote collectors allow Scrutinizer to scale beyond the single-appliance ceiling of 500 exporters with a total flow rate of 150,000 flows/s.
See below for sizing guidelines and recommendations for individual appliances in a distributed cluster.
Remote collectors#
Resource allocation for each remote collector in a distributed cluster should follow the same guidelines/recommendations as that of a single Scrutinizer appliance:
Use the expected flow rate and exporter count for the collector to determine recommended CPU and RAM allocations for core functions.
Calculate the total additional CPU cores and RAM required to support the features that will be enabled for the collector and exporters associated with it.
Provision the collector with the minimum 100 GB of disk space and the total CPU and RAM obtained from the first two steps.
After the collector has been registered as part of the cluster and is receiving flows, continue to monitor resource utilization via the Admin > Resources > System Performance page and make adjustments when necessary.
Primary reporter#
The primary reporter in a distributed environment requires the following additional resources (on top of the base resource requirements detailed above) based on the number of remote collectors in the cluster:
Resource |
Minimum |
Recommended |
|---|---|---|
CPU cores |
2x the number of remote collectors |
4x the number of remote collectors |
RAM |
2 GB for every remote collector |
4 GB for every remote collector |
Note
Primary reporters that are receiving extremely high volumes of alarm/event data from collectors may require specialized resourcing. Contact Plixer Technical Support for assistance.
Local Replicator instance#
Added in version 19.7.0: From version 19.7.0 onwards, Scrutinizer servers include a local Replicator instance that can be activated to enable automated replication and forwarding of incoming flow/packet streams.
The primary reporter in Scrutinizer deployments will require the following additional resources when the local Replicator instance is activated:
Resource |
Minimum |
|---|---|
CPU cores |
2x the number of remote collectors |
RAM |
1 GB for every remote collector |
Note
A single Replicator instance can replicate packets at rates close to line speed with sufficient CPU provisioning. However, the interface configuration and number of destination collectors must also be taken into consideration. If all packets are being replicated to two destinations, the outbound bandwidth utilization will be twice the inbound volume.
ML Engine#
The Plixer ML Engine is a supplementary appliance that provides advanced anomaly and threat detection through Scrutinizer in Plixer One Enterprise deployments.
See below for sizing guidelines and recommendations for local and cloud-based ML Engine deployments:
Note
Sizing recommendations for the ML Engine are based on flow rates and asset counts. An “asset” is either an exporter interface or a host.
Local deployments#
The following table shows the recommended resource allocations for a local Plixer ML Engine install:
CPU cores, RAM, and disk size based on flow rate and asset count
Number of assets |
||||||||||
|---|---|---|---|---|---|---|---|---|---|---|
F/s |
150 |
300 |
450 |
600 |
750 |
900 |
1050 |
1200 |
1450 |
1700 |
10k |
8 CPU 40 GB 0.2 TB |
12 CPU 80 GB 0.4 TB |
16 CPU 112 GB 0.6 TB |
20 CPU 136 GB 0.8 TB |
24 CPU 160 GB 1.0 TB |
28 CPU 184 GB 1.2 TB |
32 CPU 208 GB 1.4 TB |
36 CPU 232 GB 1.6 TB |
40 CPU 256 GB 1.8 TB |
44 CPU 256 GB 2.0 TB |
20k |
12 CPU 80 GB 0.4 TB |
14 CPU 112 GB 0.6 TB |
18 CPU 136 GB 0.8 TB |
22 CPU 160 GB 1.0 TB |
26 CPU 184 GB 1.2 TB |
30 CPU 208 GB 1.4 TB |
34 CPU 232 GB 1.6 TB |
38 CPU 244 GB 1.8 TB |
42 CPU 256 GB 2.0 TB |
46 CPU 288 GB 2.2 TB |
30k |
16 CPU 112 GB 0.6 TB |
18 CPU 136 GB 0.8 TB |
20 CPU 160 GB 1.0 TB |
24 CPU 184 GB 1.2 TB |
28 CPU 208 GB 1.4 TB |
32 CPU 232 GB 1.6 TB |
36 CPU 244 GB 1.8 TB |
40 CPU 256 GB 2.0 TB |
44 CPU 288 GB 2.2 TB |
48 CPU 320 GB 2.4 TB |
40k |
20 CPU 136 GB 0.8 TB |
22 CPU 160 GB 1.0 TB |
24 CPU 184 GB 1.2 TB |
26 CPU 208 GB 1.4 TB |
30 CPU 232 GB 1.6 TB |
34 CPU 244 GB 1.8 TB |
38 CPU 256 GB 2.0 TB |
42 CPU 288 GB 2.2 TB |
46 CPU 320 GB 2.4 TB |
50 CPU 352 GB 2.6 TB |
50k |
24 CPU 160 GB 1.0 TB |
26 CPU 184 GB 1.2 TB |
28 CPU 208 GB 1.4 TB |
30 CPU 232 GB 1.6 TB |
32 CPU 244 GB 1.8 TB |
36 CPU 256 GB 2.0 TB |
40 CPU 288 GB 2.2 TB |
44 CPU 320 GB 2.4 TB |
48 CPU 352 GB 2.6 TB |
52 CPU 384 GB 2.8 TB |
60k |
28 CPU 184 GB 1.2 TB |
30 CPU 208 GB 1.4 TB |
32 CPU 232 GB 1.6 TB |
34 CPU 244 GB 1.8 TB |
36 CPU 256 GB 2.0 TB |
38 CPU 288 GB 2.2 TB |
42 CPU 320 GB 2.4 TB |
46 CPU 352 GB 2.6 TB |
50 CPU 384 GB 2.8 TB |
54 CPU 416 GB 3.0 TB |
70k |
32 CPU 208 GB 1.4 TB |
34 CPU 232 GB 1.6 TB |
36 CPU 244 GB 1.8 TB |
38 CPU 256 GB 2.0 TB |
40 CPU 288 GB 2.2 TB |
42 CPU 352 GB 2.4 TB |
46 CPU 352 GB 2.6 TB |
50 CPU 384 GB 2.8 TB |
54 CPU 448 GB 3.0 TB |
56 CPU 448 GB 3.2 TB |
80k |
36 CPU 232 GB 1.6 TB |
38 CPU 256 GB 1.8 TB |
40 CPU 288 GB 2.0 TB |
42 CPU 320 GB 2.2 TB |
44 CPU 352 GB 2.4 TB |
46 CPU 384 GB 2.6 TB |
50 CPU 416 GB 2.8 TB |
54 CPU 448 GB 3.0 TB |
56 CPU 480 GB 3.2 TB |
56 CPU 480 GB 3.4 TB |
90k |
40 CPU 256 GB 1.8 TB |
42 CPU 288 GB 2.0 TB |
44 CPU 320 GB 2.2 TB |
46 CPU 352 GB 2.4 TB |
48 CPU 384 GB 2.6 TB |
52 CPU 416 GB 2.8 TB |
54 CPU 448 GB 3.0 TB |
56 CPU 480 GB 3.2 TB |
56 CPU 512 GB 3.4 TB |
56 CPU 512 GB 3.6 TB |
100k |
44 CPU 256 GB 2.0 TB |
46 CPU 288 GB 2.2 TB |
48 CPU 320 GB 2.4 TB |
50 CPU 352 GB 2.6 TB |
52 CPU 384 GB 2.8 TB |
54 CPU 416 GB 3.0 TB |
56 CPU 448 GB 3.2 TB |
56 CPU 480 GB 3.4 TB |
56 CPU 512 GB 3.6 TB |
56 CPU 512 GB 3.6 TB |
AWS deployments#
When deploying the Plixer ML Engine as an AWS AMI, use the following table to determine the appropriate instance type and amount of storage:
Instance type (xxxxxxxlarge) and Elastic Block Storage size based on flow rate and asset count
Number of assets |
||||||||||
|---|---|---|---|---|---|---|---|---|---|---|
F/s |
150 |
300 |
450 |
600 |
750 |
900 |
1050 |
1200 |
1450 |
1700 |
10k |
r5a.2 0.2 TB |
r5a.4 0.4 TB |
r5a.4 0.6 TB |
r5a.8 0.8 TB |
r5a.8 1.0 TB |
r5a.8 1.2 TB |
r5a.8 1.4 TB |
r5a.12 1.6 TB |
r5a.12 1.8 TB |
r5a.12 2.0 TB |
20k |
r5a.4 0.4 TB |
r5a.4 0.6 TB |
r5a.8 0.8 TB |
r5a.8 1.0 TB |
r5a.8 1.2 TB |
r5a.8 1.4 TB |
r5a.12 1.6 TB |
r5a.12 1.8 TB |
r5a.12 2.0 TB |
r5a.12 2.2 TB |
30k |
r5a.4 0.6 TB |
r5a.8 0.8 TB |
r5a.8 1.0 TB |
r5a.8 1.2 TB |
r5a.8 1.4 TB |
r5a.8 1.6 TB |
r5a.12 1.8 TB |
r5a.12 2.0 TB |
r5a.12 2.2 TB |
r5a.12 2.4 TB |
40k |
r5a.8 0.8 TB |
r5a.8 1.0 TB |
r5a.8 1.2 TB |
r5a.8 1.4 TB |
r5a.8 1.6 TB |
r5a.12 1.8 TB |
r5a.12 2.0 TB |
r5a.12 2.2 TB |
r5a.12 2.4 TB |
r5a.16 2.6 TB |
50k |
r5a.8 1.0 TB |
r5a.8 1.2 TB |
r5a.8 1.4 TB |
r5a.8 1.6 TB |
r5a.12 1.8 TB |
r5a.12 2.0 TB |
r5a.12 2.2 TB |
r5a.12 2.4 TB |
r5a.12 2.6 TB |
r5a.16 2.8 TB |
60k |
r5a.8 1.2 TB |
r5a.8 1.4 TB |
r5a.8 1.6 TB |
r5a.12 1.8 TB |
r5a.12 2.0 TB |
r5a.12 2.2 TB |
r5a.12 2.4 TB |
r5a.12 2.6 TB |
r5a.16 2.8 TB |
r5a.16 3.0 TB |
70k |
r5a.8 1.4 TB |
r5a.12 1.6 TB |
r5a.12 1.8 TB |
r5a.12 2.0 TB |
r5a.12 2.2 TB |
r5a.12 2.4 TB |
r5a.12 2.6 TB |
r5a.16 2.8 TB |
r5a.16 3.0 TB |
r5a.16 3.2 TB |
80k |
r5a.12 1.6 TB |
r5a.12 1.8 TB |
r5a.12 2.0 TB |
r5a.12 2.2 TB |
r5a.12 2.4 TB |
r5a.12 2.6 TB |
r5a.16 2.8 TB |
r5a.16 3.0 TB |
r5a.16 3.2 TB |
r5a.16 3.4 TB |
90k |
r5a.12 1.8 TB |
r5a.12 2.0 TB |
r5a.12 2.2 TB |
r5a.12 2.4 TB |
r5a.12 2.6 TB |
r5a.16 2.8 TB |
r5a.16 3.0 TB |
r5a.16 3.2 TB |
r5a.16 3.4 TB |
r5a.16 3.6 TB |
100k |
r5a.12 2.0 TB |
r5a.12 2.2 TB |
r5a.12 2.4 TB |
r5a.16 2.6 TB |
r5a.16 2.8 TB |
r5a.16 3.0 TB |
r5a.16 3.2 TB |
r5a.16 3.4 TB |
r5a.16 3.6 TB |
r5a.16 3.6 TB |
Azure deployments#
When deploying the Plixer ML Engine as an Azure VM image, use the following table to determine the appropriate VM size and amount of storage:
VM size (Standard_xxxxxx) and Azure Disk Storage size based on flow rate and asset count
Number of assets |
||||||||||
|---|---|---|---|---|---|---|---|---|---|---|
F/s |
150 |
300 |
450 |
600 |
750 |
900 |
1050 |
1200 |
1450 |
1700 |
10k |
D13_v2
0.2 TB
|
D14_v2
0.4 TB
|
D14_v2
0.6 TB
|
E20_v5
0.8 TB
|
E20_v5
1.0 TB
|
E32_v5
1.2 TB
|
E32_v5
1.4 TB
|
E32_v5
1.6 TB
|
E48_v5
1.8 TB
|
E48_v5
2.0 TB
|
20k |
D14_v2
0.4 TB
|
D14_v2
0.6 TB
|
E20_v5
0.8 TB
|
E20_v5
1.0 TB
|
E32_v5
1.2 TB
|
E32_v5
1.4 TB
|
E32_v5
1.6 TB
|
E48_v5
1.8 TB
|
E48_v5
2.0 TB
|
E48_v5
2.2 TB
|
30k |
D14_v2
0.6 TB
|
E20_v5
0.8 TB
|
E20_v5
1.0 TB
|
E32_v5
1.2 TB
|
E32_v5
1.4 TB
|
E32_v5
1.6 TB
|
E48_v5
1.8 TB
|
E48_v5
2.0 TB
|
E48_v5
2.2 TB
|
E48_v5
2.4 TB
|
40k |
E20_v5
0.8 TB
|
E20_v5
1.0 TB
|
E32_v5
1.2 TB
|
E32_v5
1.4 TB
|
E32_v5
1.6 TB
|
E48_v5
1.8 TB
|
E48_v5
2.0 TB
|
E48_v5
2.2 TB
|
E48_v5
2.4 TB
|
E64_v5
2.6 TB
|
50k |
E20_v5
1.0 TB
|
E32_v5
1.2 TB
|
E32_v5
1.4 TB
|
E32_v5
1.6 TB
|
E48_v5
1.8 TB
|
E48_v5
2.0 TB
|
E48_v5
2.2 TB
|
E48_v5
2.4 TB
|
E48_v5
2.6 TB
|
E64_v5
2.8 TB
|
60k |
E32_v5
1.2 TB
|
E32_v5
1.4 TB
|
E32_v5
1.6 TB
|
E48_v5
1.8 TB
|
E48_v5
2.0 TB
|
E48_v5
2.2 TB
|
E48_v5
2.4 TB
|
E48_v5
2.6 TB
|
E64_v5
2.8 TB
|
E64_v5
3.0 TB
|
70k |
E32_v5
1.4 TB
|
E32_v5
1.6 TB
|
E48_v5
1.8 TB
|
E48_v5
2.0 TB
|
E48_v5
2.2 TB
|
E48_v5
2.4 TB
|
E48_v5
2.6 TB
|
E64_v5
2.8 TB
|
E64_v5
3.0 TB
|
E64_v5
3.2 TB
|
80k |
E32_v5
1.6 TB
|
E48_v5
1.8 TB
|
E48_v5
2.0 TB
|
E48_v5
2.2 TB
|
E48_v5
2.4 TB
|
E48_v5
2.6 TB
|
E64_v5
2.8 TB
|
E64_v5
3.0 TB
|
E64_v5
3.2 TB
|
E64_v5
3.4 TB
|
90k |
E48_v5
1.8 TB
|
E48_v5
2.0 TB
|
E48_v5
2.2 TB
|
E48_v5
2.4 TB
|
E48_v5
2.6 TB
|
E64_v5
2.8 TB
|
E64_v5
3.0 TB
|
E64_v5
3.2 TB
|
E64_v5
3.4 TB
|
E64_v5
3.6 TB
|
100k |
E48_v5
2.0 TB
|
E48_v5
2.2 TB
|
E48_v5
2.4 TB
|
E64_v5
2.6 TB
|
E64_v5
2.8 TB
|
E64_v5
3.0 TB
|
E64_v5
3.2 TB
|
E64_v5
3.4 TB
|
E64_v5
3.6 TB
|
E64_v5
3.6 TB
|
Note
To learn more about ML Engine licensing options and deployment procedures, contact Plixer Technical Support.