Deployment Guides#
FlowPro is available in deployment packages for ESXi, Hyper-V, and KVM. Hardware appliances are also available upon request.
Contact Plixer Technical Support or a local reseller for availability and licensing or visit www.plixer.com to learn more.
Note
FlowPro 20.1.0 requires Scrutinizer 19.5.x or higher.
Before deploying any type of FlowPro appliance, complete these steps to add a license via the Scrutinizer web interface.
On this page:
Pre-deployment#
As part of the installation process, the following preparatory steps should be completed before deploying the FlowPro appliance. Review the subsections below for optimal deployment locations, recommended resource allocation, and licensing instructions.
License and probe registration#
Before a FlowPro appliance is deployed, it must first be licensed and registered through the Scrutinizer web interface.
Adding a license
Note
If the following steps have already been completed, proceed to reviewing the resource requirements and deployment recommendations below.
To obtain and set up a new FlowPro license, follow these steps:
Contact Plixer Technical Support and provide them with the Customer ID and Machine ID found under Admin > Plixer > FlowPro Licensing in the Scrutinizer web interface.
Paste the key in the License Key field on the same page.
Click Save.
After a license key has successfully been added, the page will display the number of probes supported by the license as well as registered and deployed probe counts.
Registering a new probe
After a license key has been added, the FlowPro appliance/probe can be registered as follows:
Navigate to Admin > Resources > FlowPro Probes in the Scrutinizer web interface.
Click the + button and enter the following details in the Add Probe tray:
A name to identify the probe in Scrutinizer
The probe’s MGMT interface IP address
The Scrutinizer collector to assign the probe to
[Optional] Leave Default NIDS Rules enabled to import NIDS rules from open-source threat feeds for network event reporting.
Click the Save button to register the probe configuration.
[Optional] To deploy multiple appliances, repeat the above steps until they have all been registered.
Confirm that the probe has been correctly registered in the main FlowPro Probes view, and then proceed to deploying the hardware or virtual appliance.
Note
A license key and probe must be registered in Scrutinizer before the FlowPro appliance(s) is deployed. The MGMT IP address configured in Scrutinizer must also match the address assigned during the initial setup process after the appliance’s first boot.
If the Default NIDS Rules option is disabled, the probe will send only basic IPFIX observations, unless custom rules are manually added to the probe.
FlowPro keys can be obtained from Plixer Technical Support and entered via the probe management page (for Scrutinizer versions below 19.6.0, the FlowPro key must be be entered via the FlowPro CLI).
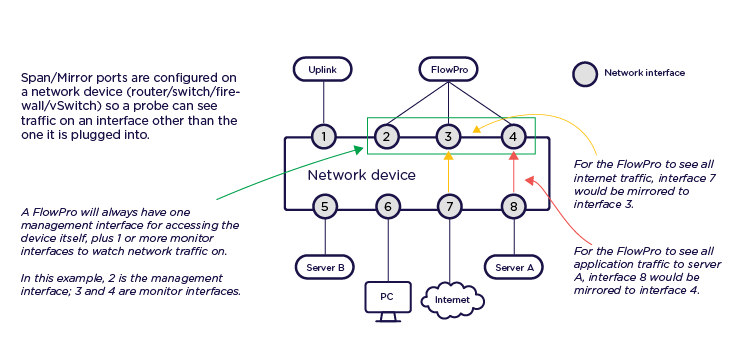
SPAN configuration#
By default, the monitor interfaces of a FlowPro appliance are set to promiscuous mode and can be connected directly to a mirrored port. This allows the appliance to be deployed in the optimal location for maximizing coverage and functionality.
Note
For remote SPAN (RSPAN) configuration instruction, see this guide.
A 1 GB interface can be monitored using either separate SPAN interfaces for Rx/ingress and Tx/egress traffic or a single SPAN interface for both directions. Using dedicated SPANs for Rx and Tx traffic is recommended to allow for better traffic distribution and avoid potential bottlenecks. Rx and Tx SPAN interfaces can be configured as part of the FlowPro appliance’s initial setup process.
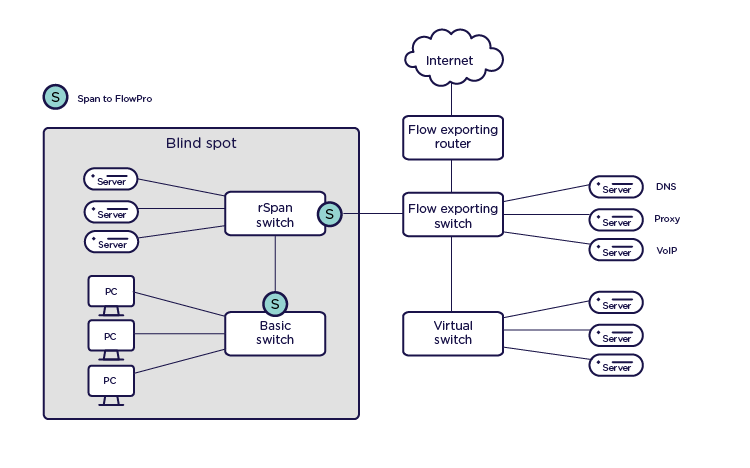
The image below shows the recommended deployment locations for FlowPro based on the functions/features that will be enabled:
FlowPro (core probe functions)#
Updating the Scrutinizer reporter#
If the original primary Scrutinizer reporter in a high-availability configuration becomes permanently unavailable, FlowPro probes will need to be updated to point to the new primary reporter as follows:
SSH to the FlowPro server using the
plixer:flowprocredentials.Run the following command to stop the FlowPro service:
sudo service flowpro stopUpdate the value for
reporter_addressin the/home/plixer/flowpro/flowpro-settings.yamlfile.Then run the following command to restart the FlowPro service:
sudo service flowpro start
Virtual appliances#
See below for recommended resource scaling for FlowPro virtual appliances:
CPU and RAM#
Default VM configuration |
Medium traffic (up to 1 Gb/s) |
High traffic (up to 10 Gb/s) |
|---|---|---|
8 CPU cores |
6-10 CPU cores |
10-18 CPU cores |
Storage#
Storage requirements scale with selective packet capture workloads and can be approximated using the following formula:
Capture depth * Max MTU of monitored interfaces * Expected number of source host:well-known port:destination host combinations that will be stored for the specified retention duration
The values above are stored in ~/flowpro/flowpro-settings.yaml, where:
Capture depth (
$pcap.server_capture_depth) is the number of payload observations to be maintained per capture.Retention duration (
$pcap.server_ttl_hours) is the number of hours captures are stored after the last observation.
ESXi deployment
The FlowPro virtual appliance for ESXi is provided as an all-in-one OVA template to streamline the deployment process.
Deploying the OVA Template
To deploy the FlowPro virtual appliance in ESXi, follow these steps:
Contact Plixer Technical Support and use the link they provide (
https://files.plixer.com/PACKAGE_PATH_AND_FILENAME) to download the latest VMware virtual appliance package.Extract the contents of the package to a location on the ESXi server.
In vSphere or vCenter, right-click the host to deploy the appliance to, and then select Deploy OVF Template from the menu.
Select Local file and browse to the FlowPro OVF and VMDK files before clicking Next.
Provide a name for the FlowPro virtual appliance and continue to follow the deployment wizard.
When prompted, select the datastore, set the disk format to Thick Provision, and then click Next.
Select the network to be used by the virtual appliance, and then verify the configuration in the summary before clicking Finish to import the Scrutinizer virtual appliance. This may take a few moments.
After the FlowPro virtual appliance has been successfully deployed, add the necessary monitoring interfaces (as explained below) before proceeding with the initial appliance configuration.
Adding new interfaces
After the appliance is deployed, at least one additional interface will need to be created for monitoring.
To add a new interface to the FlowPro virtual appliance, follow these steps:
In vCenter, right click on the FlowPro VM, and then select Edit Settings….
Select Add New Device, and then select Network Adapter from the dropdown.
Available interfaces can be verified by checking Flowpro.Interfaces in ~/flowpro/flowpro-settings.yaml after the initial appliance configuration is completed.
Note
The virtual appliance will be configured with one network adapter (MGMT) by default.
To monitor a different network, a mirror port of a virtual distributed switch or a mirror port using a physical NIC on the ESXi server will need to be configured.
Monitoring interfaces can also be created at a later time. Follow these steps to register and connect additional interfaces.
Hyper-V deployment
The FlowPro virtual appliance for Hyper-V is provided as an all-in-one VHD template to streamline the deployment process.
Importing the virtual machine
To deploy the FlowPro virtual appliance in Hyper-V, follow these steps:
Contact Plixer Technical Support and use the link they provide (
https://files.plixer.com/PACKAGE_PATH_AND_FILENAME) to download the latest Hyper-V virtual appliance package.Extract the contents of the package to a location on the Hyper-V server.
Open Hyper-V Manager, right-click the virtual machine, and then select Import Virtual Machine.
Browse to the location of the FlowPro appliance folder.
Select the FlowPro virtual machine and click Next.
Use the radio buttons to select the import operation type and click Next.
Verify the settings in the summary and click Finish to import the virtual machine.
After the FlowPro virtual appliance has been successfully deployed, add the necessary monitoring interfaces (as explained below) before proceeding with the initial appliance configuration.
Adding new interfaces
After the appliance is deployed, at least one additional interface will need to be created for monitoring.
To add a new interface to the FlowPro virtual appliance, follow these steps:
After downloading the latest version of the FlowPro virtual appliance, unzip the package on the Hyper-V server.
In Hyper-V Manager, right click on the VM, and then select Settings….
From the Settings… window, select Add Hardware.
From the dropdown menu, click Network Adapter.
Available interfaces can be verified by checking Flowpro.Interfaces in ~/flowpro/flowpro-settings.yaml after the initial appliance configuration is completed.
Note
The virtual appliance will be configured with one network adapter (MGMT) by default.
To monitor a different network, a mirror port of a virtual distributed switch or a mirror port using a physical NIC on the Hyper-V server will need to be configured.
Monitoring interfaces can also be created at a later time. Follow these steps to register and connect additional interfaces.
KVM deployment
The FlowPro virtual appliance for KVM is provided as an all-in-one OVA template to streamline the deployment process.
Importing the virtual machine
To deploy the FlowPro virtual appliance in KVM, follow these steps:
Contact Plixer Technical Support and use the link they provide to download the latest KVM virtual appliance package:
curl -k -o PACKAGE_FILENAME.tar.gz https://files.plixer.com/PACKAGE_PATH/PACKAGE_FILENAME.tar.gz
Create a directory for the install:
mkdir /kvm/flowpro
Extract the contents of the package to the new directory:
sudo tar xvzf PACKAGE_FILENAME.tar.gz -C /kvm/flowpro/
Run the installation script in the new directory:
cd /kvm/flowpro/PACKAGE_FILENAME
sudo ./deploy-flowpro.sh
Wait for the confirmation that the virtual machine has been created from the image.
After the FlowPro virtual machine has been created, add the necessary monitoring interfaces (as explained below) before proceeding with the initial appliance configuration.
Adding new interfaces
After the appliance is deployed, at least one additional interface will need to be created for monitoring.
To add a new interface to the FlowPro virtual appliance, follow these steps:
virsh attach-interface --domain <VM_NAME> --type network --source default --model virtio --config --live
Available interfaces can be verified by checking Flowpro.Interfaces in ~/flowpro/flowpro-settings.yaml after the initial appliance configuration is completed.
Note
The virtual appliance will be configured with one network adapter (MGMT) by default.
To monitor a different network, a mirror port of a virtual distributed switch or a mirror port using a physical NIC on the KVM server will need to be configured.
Monitoring interfaces can also be created at a later time. Follow these steps to register and connect additional interfaces.
Hardware appliance#
After removing the FlowPro hardware appliance from its packaging, verify that all accompanying accessories (rackmount kit, appliance-locking bezel and keys, and power cord) are included. The appliance can be mounted in a standard 19-inch rack or cabinet.
Important
If your box arrives torn, dented, or otherwise damaged, the appliance itself seems damaged, or there are missing parts, contact Plixer Technical Support immediately and do not attempt to install the unit.
From there, follow these steps to set up the FlowPro hardware appliance:
Connect the power cable to one of the power supply sockets and plug the other end to a grounded AC outlet or UPS. To take advantage of the redundant PSUs, ensure that each socket is connected to an independent power source.
Connect the appliance to the network using the MGMT port.
Refer to these deployment location recommendations, and then connect the necessary cables to the monitoring ports.
Connect the iDRAC port to a remote access controller using an RJ-45 cable to enable remote console access for hardware management and monitoring. Contact Plixer Technical Support for help with configuring alerts for hardware-related events.
After the FlowPro hardware appliance has been racked and cabled, proceed to configuring the appliance.
Initial configuration#
Once the FlowPro appliance has been deployed and the necessary monitoring interfaces have been added, power it on and log into the console using the credentials root:plixer. The appliance will go through a quick initialization sequence and then reboot.
Note
For hardware appliances, SSH to 192.168.168.168/24 using the credentials
plixer:flowproinstead. KVM appliances should runvirsh console Plixer FlowProand log in with the credentialsplixer:flowpro.Before proceeding, review these pre-deployment notes and complete the licensing process.
Appliance setup#
After the reboot, log in again and follow the initial setup prompts:
View instructions
Review and accept the EULA.
Configure the networking properties and user credentials for the appliance:
Appliance hostname (must be a fully qualified hostname)
Static IP address (must match the address registered for the probe in Scrutinizer)
CIDR (mask only - 8, 16, etc.)
Gateway
DNS IP
New password for the
rootuserNew password for the
plixeruser
Wait for the appliance to reboot, and then SSH to the IP address entered as the
plixeruser with the new password.Provide the following Scrutinizer details:
Current password for the
plixeruserIP address of the Scrutinizer server (or the primary reporter in distributed clusters)
Destination collector address (either same standalone server as above, a remote collector in a distributed cluster, or a Replicator instance)
Authentication token generated after the probe was registered in Scrutinizer
Enter the following details to generate a new SSL certificate:
Country name: 2-letter country code
State or province name: Complete state or province name
Locality name: Complete locality or city name
Organizational unit name: Section
Common name: Server FQDN or your name
Alternative DNS name 1 (press Enter to stop adding)
Select whether the appliance can access the Internet or to continue the setup locally, and then follow any additional instructions.
If a FlowPro key has not been entered via the Scrutinizer web interface, select Yes to enter it when prompted.
Enter the address of the NTP server to use for clock-syncing.
After the initial appliance setup has been completed, monitoring interfaces should be registered and connected to observation points.
Note
The setup script automatically generates both a self-signed certificate and a certificate signing request (~/flowpro/server.csr). After getting the request signed by a certificate authority, overwrite the existing ~/flowpro/server.crt. To continue using the self-signed certificate, navigate to https://<FLOWPRO_MGMT_IP>:8080 on each user browser and accept the security exception.
Registering and connecting interfaces#
Once the appliance is running, all monitoring interfaces must be registered and connected to observation points as follows:
View instructions
Note
Monitoring interfaces can be added at any time following the corresponding instructions for ESXi, Hyper-V, or KVM deployments. The steps below must be completed after new monitoring interfaces are added.
Register all additional interfaces as
monXinterfaces:
cd flowpro
sudo ./setup.sh --monitor-ports
Create one or more observation points by specifying Rx and Tx interface pairs for monitoring:
sudo ./setup.sh --create-observation-point
To verify that the interfaces have been successfully registered and connected, check Flowpro.Interfaces in ~/flowpro/flowpro-settings.yaml.
Configuring ERSPAN#
To configure traffic mirroring via ERSPAN, do the following:
View instructions
After the monitoring interfaces have been added and registered, run the following command:
sudo ./setup.sh --erspan-config
Then enter the following details for the configuration:
IP address to assign to a monX interface
Source IP
Destination IP
ERSPAN ID and key
Setup utility runmodes#
After the initial setup process, you can manually execute ~/flowpro/setup.sh to re-run the entire setup utility.
You can also run a specific configuration task by running the following command:
sudo ./setup.sh [OPTION]
Then replace [OPTION] with the specific flag that corresponds to the service you want to configure.
The following optional flags are available for this process:
View content
Reset |
|
Back up the current configuration |
|
Register all interfaces as monX interfaces |
|
Configure exporter settings, including MGMT IP, Scrutinizer server/reporter IP, collector IP, and authentication token; configure Kafka if ML Engine ETA IP is provided |
|
Configure SSL certificate details and re-create the self-signed certificate and certificate signing request |
|
Pull Suricata image from Dockerhub and set up Docker environment (also supports offline setup with a local Docker image) |
|
Configure ERSPAN settings |
|
Reset firewall settings to default |
|
Configure Rx and Tx interface pairs for monitoring |
|
Add/edit a FlowPro key (written to |
|
Configure NTP server details (written to |
|
FlowPro service management#
The FlowPro service is managed using the following command:
service flowpro [start|stop|restart]